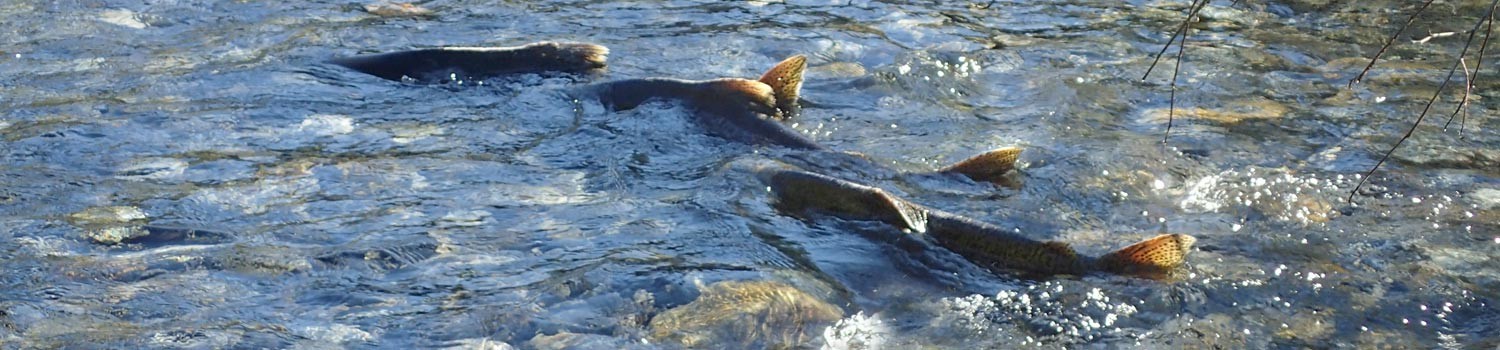
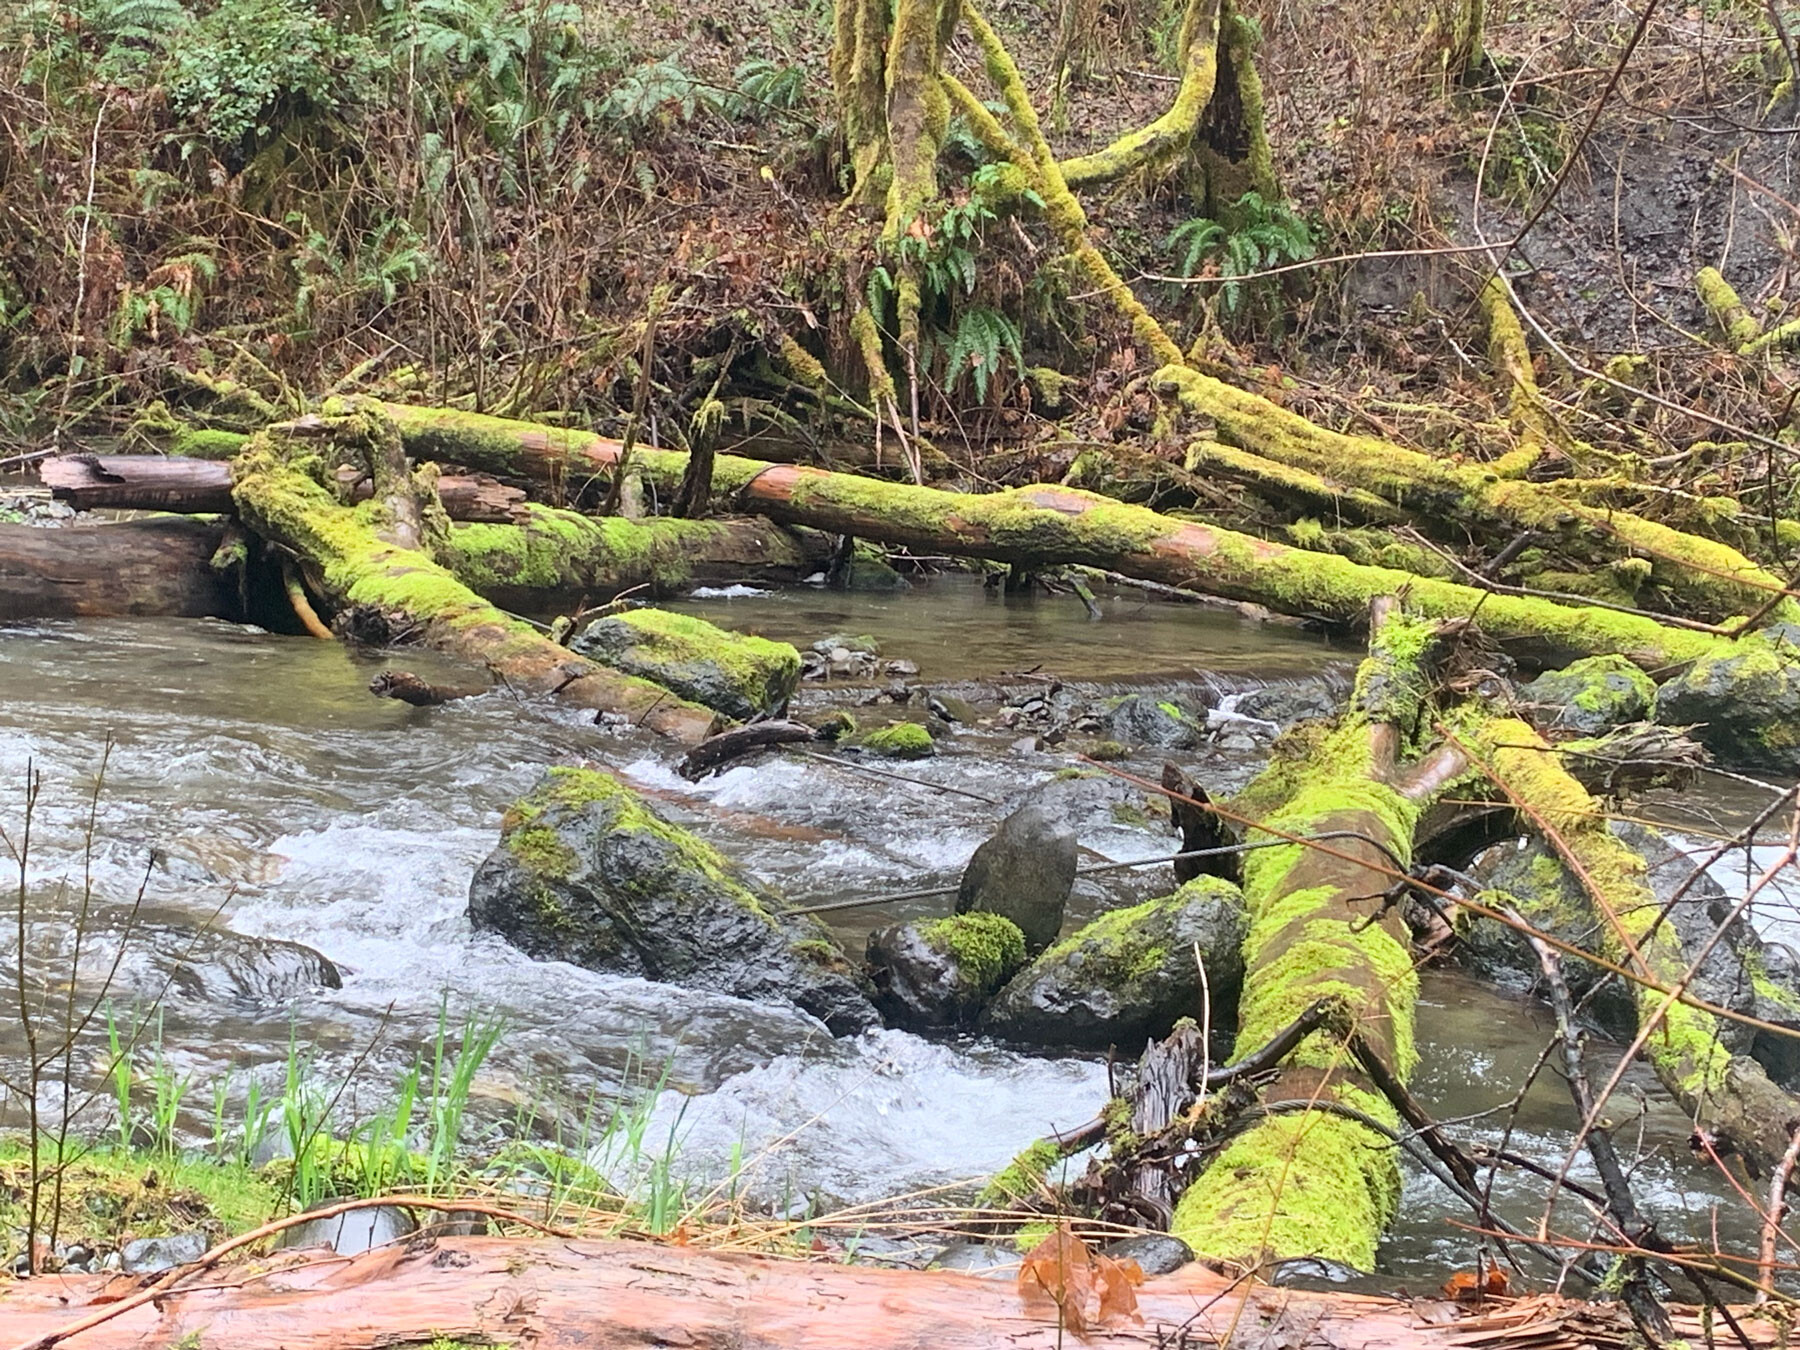
Indian Creek is a very important, highly productive salmon-bearing tributary to the Elwha River. Indian Creek provides slower moving water and protected habitat which is particularly important place of refuge for salmon to escape winter high flows. The Elwha River and its tributaries are home to all five native species of Pacific Salmon including Chinook, Coho, Pink, Chum and Sockeye along with Steelhead, Bull Trout, Cutthroat and Rainbow Trout.
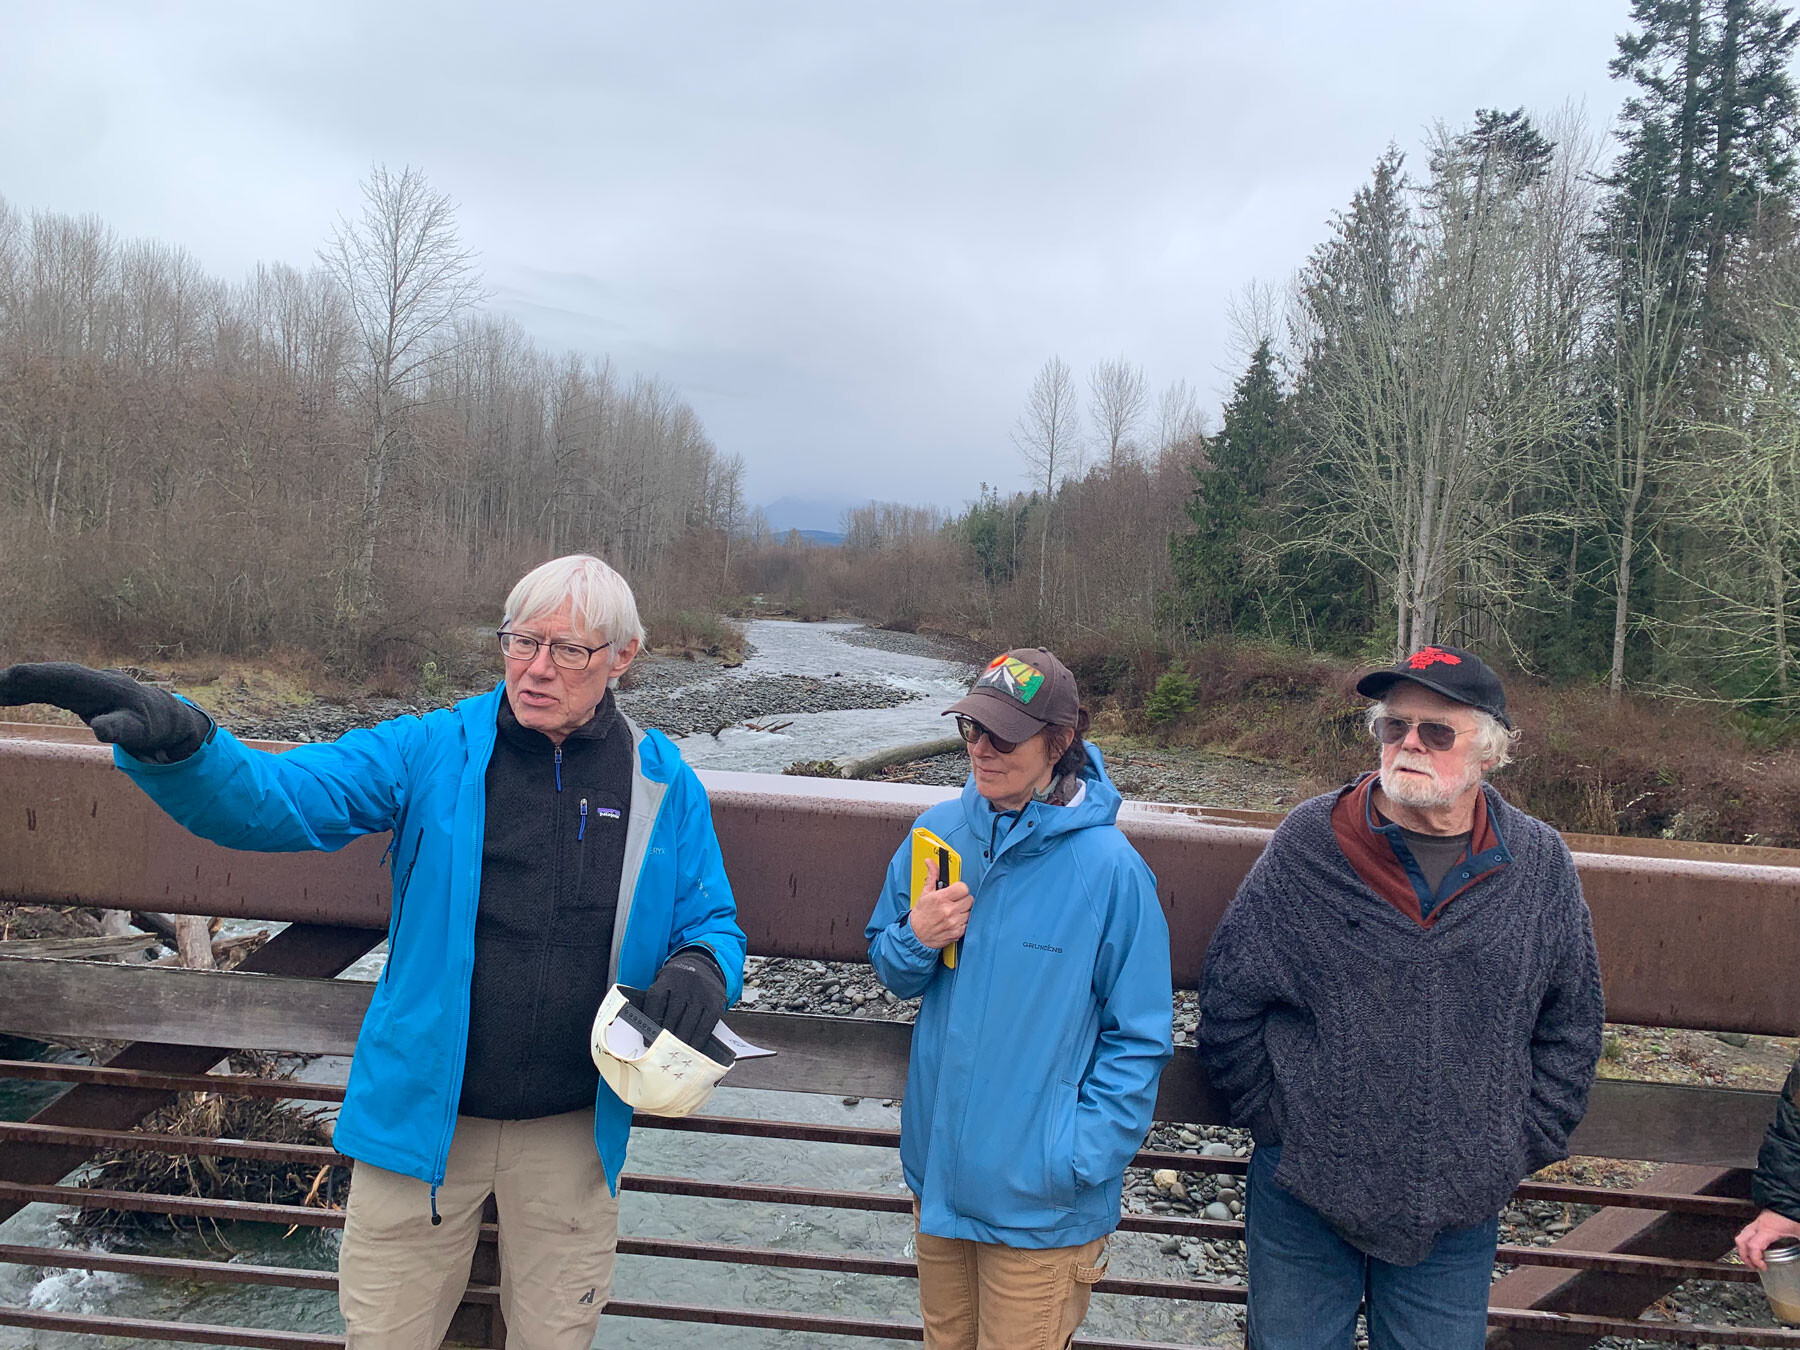
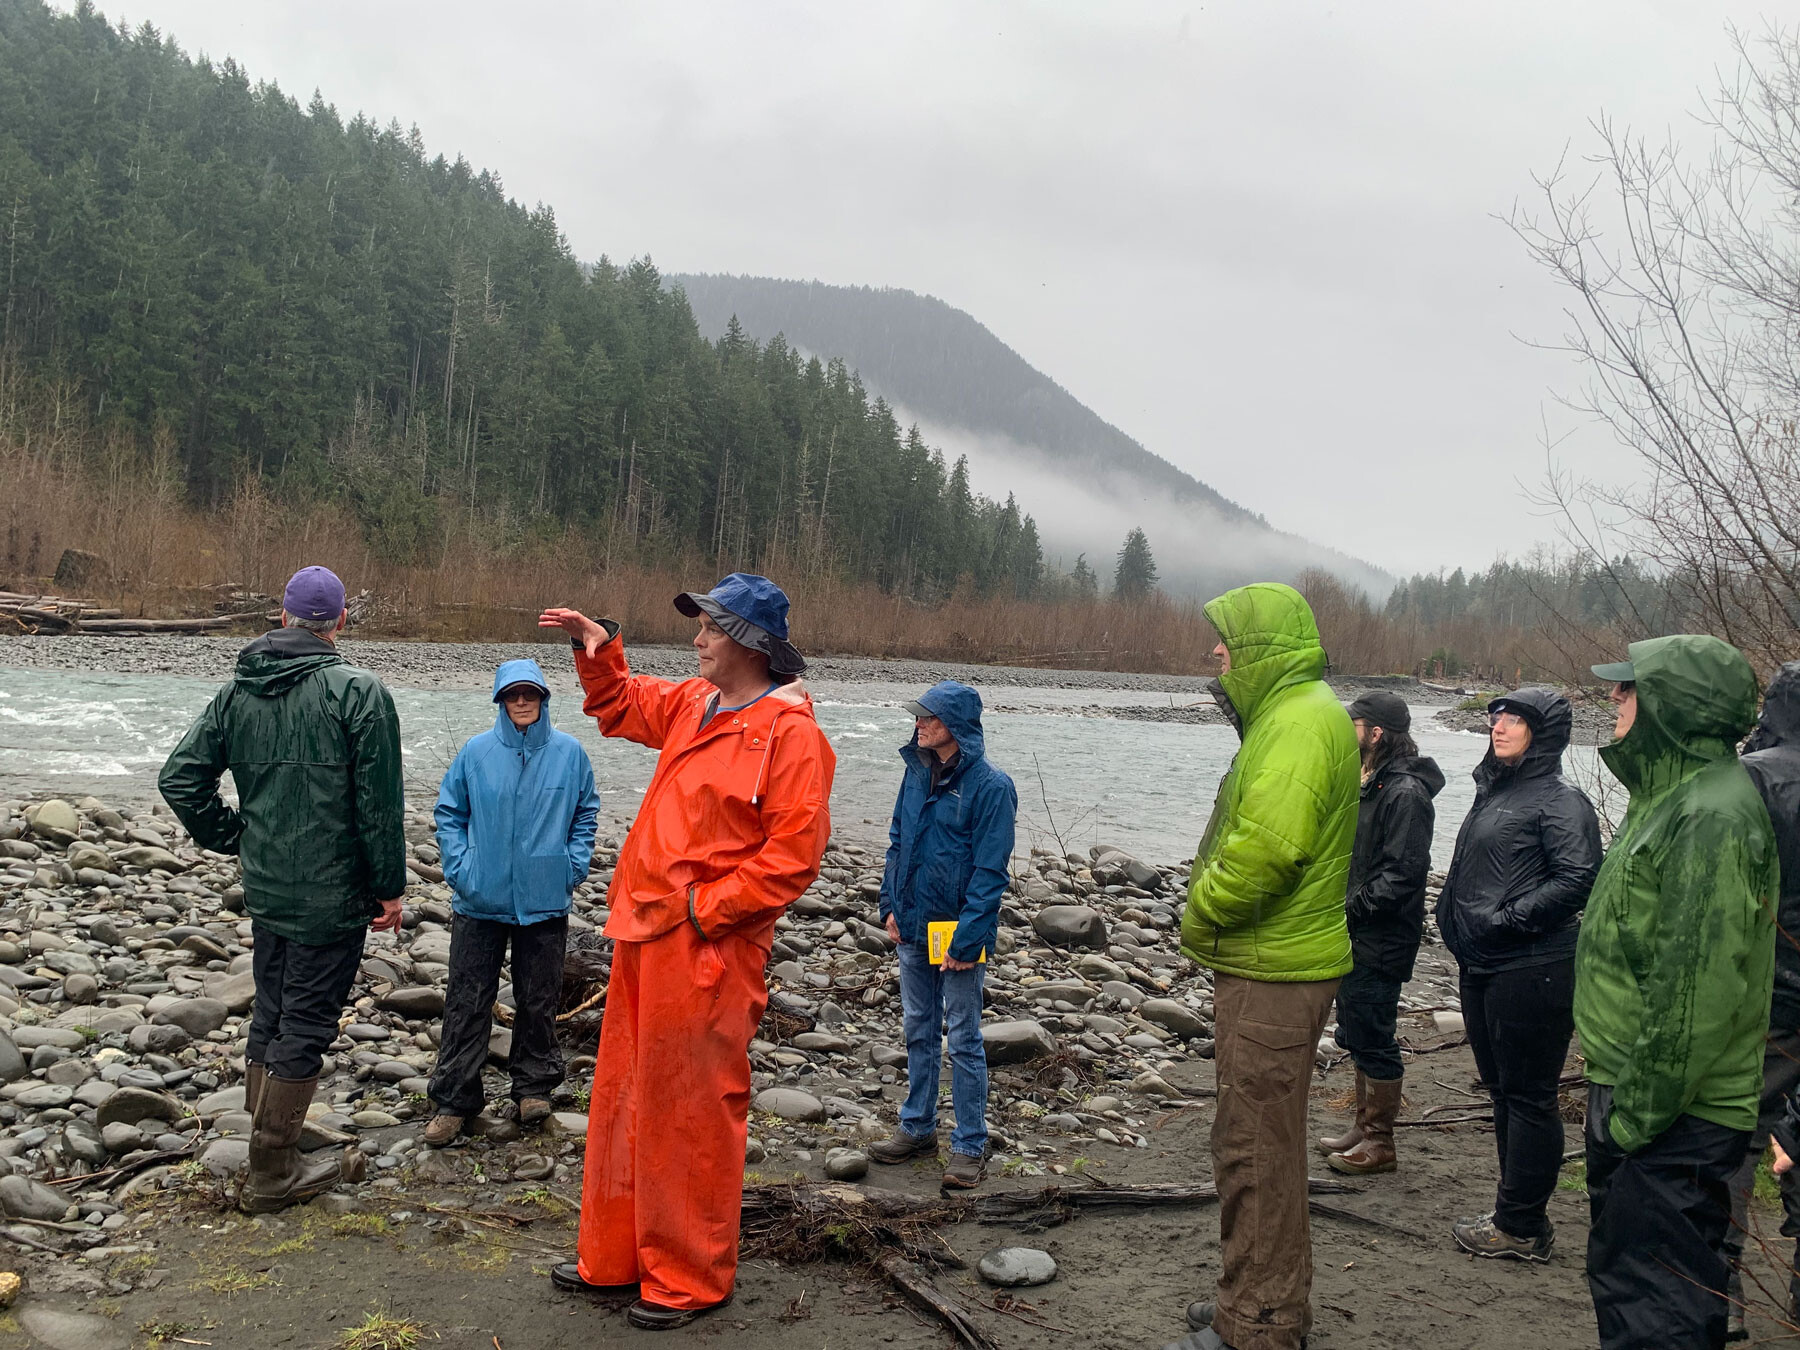
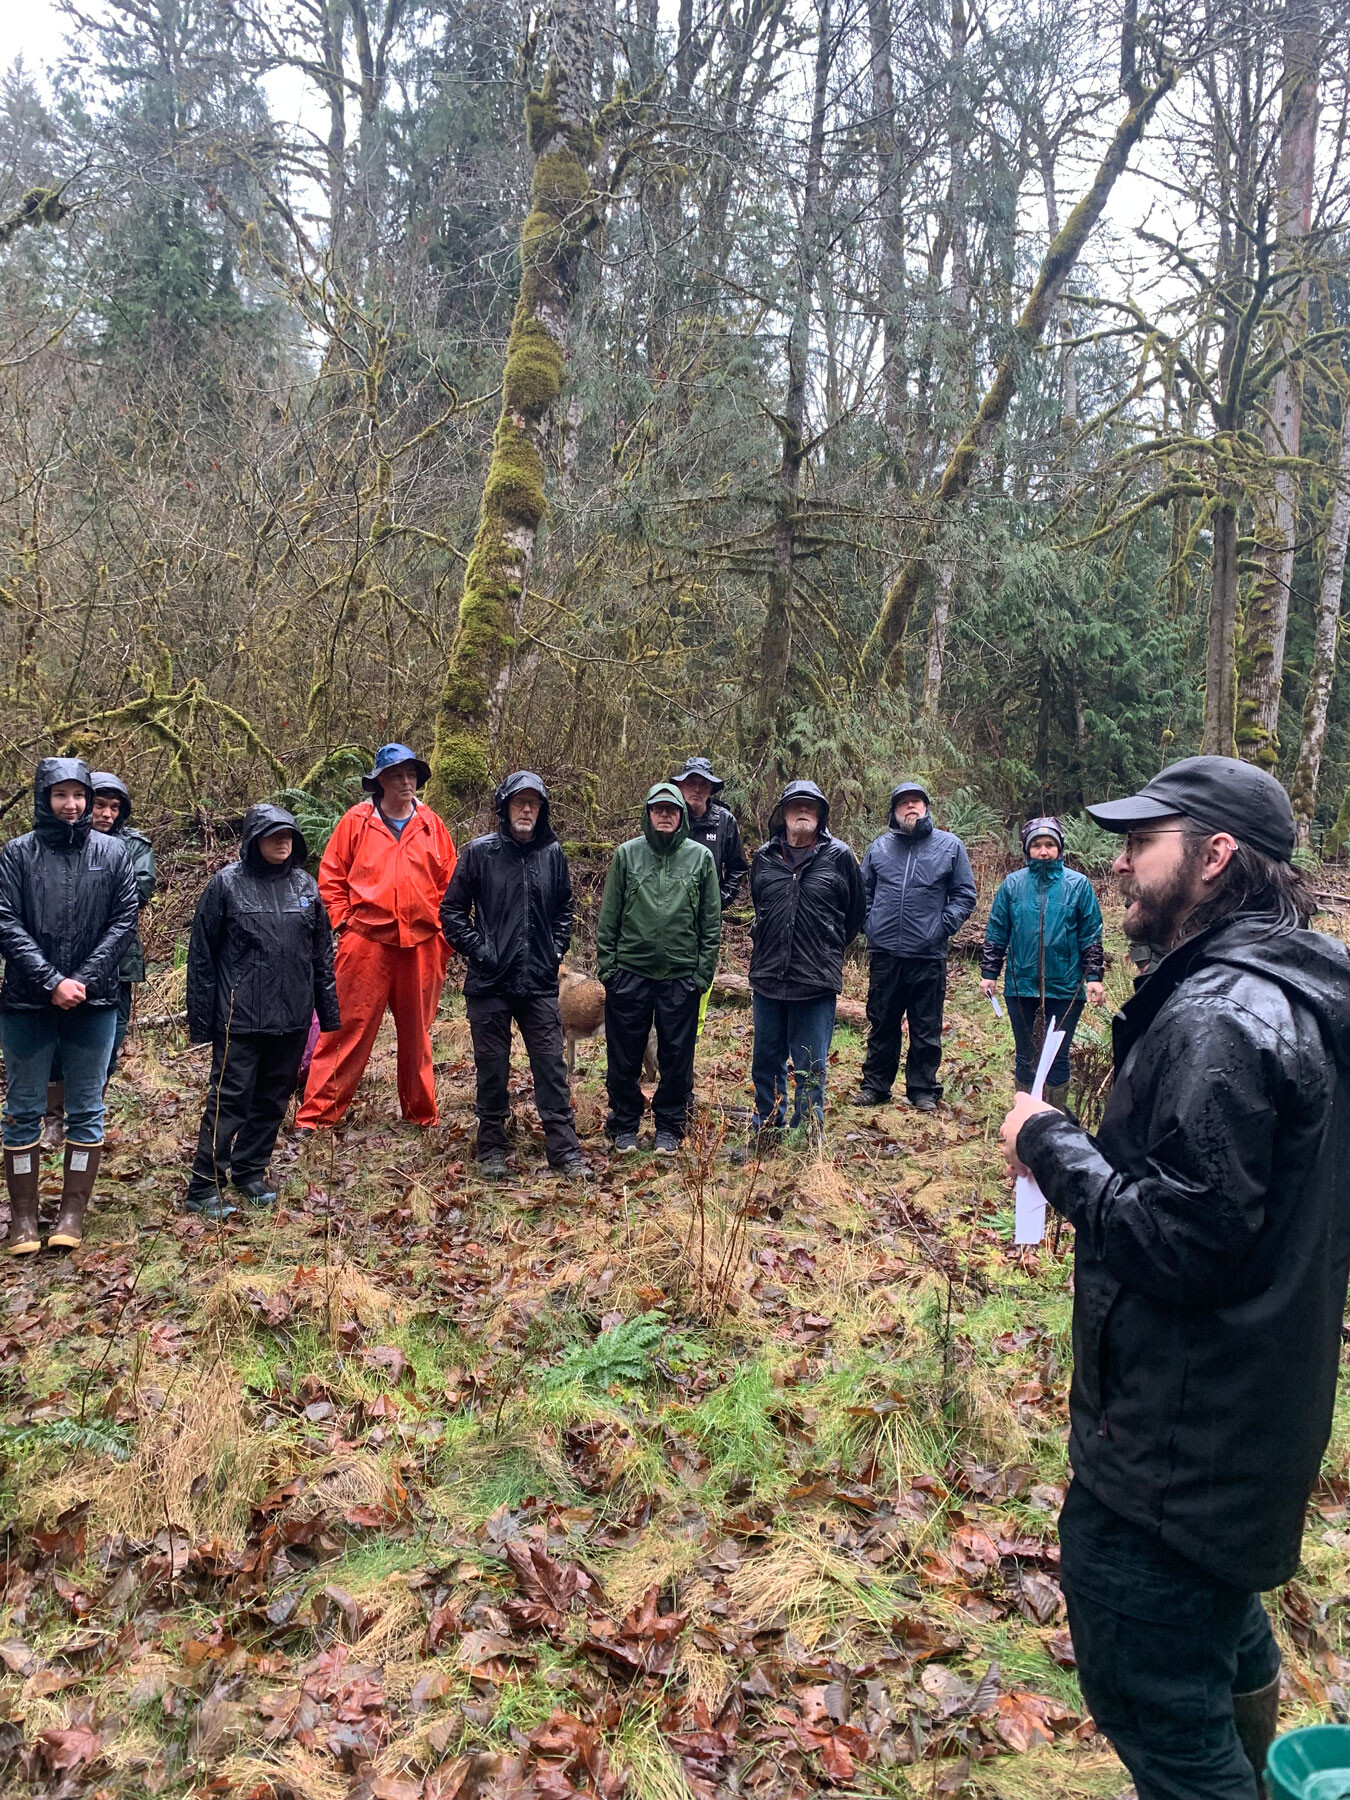
The smaller photos left to right, include Project Sponsor Jamie Michel, with the Lower Elwha Klallam Tribe; speaking with members of the North Olympic Lead Entity for Salmon and Salmon Recovery Funding Board’s Review Team. In the middle photo, Project Sponsor Randy Johnson with the Jamestown S’Klallam Tribe talks with SRFB Review Panel Member Michelle Cramer and Coleman Byrnes with the Lead Entity’s Technical Team about protection efforts in the Lower Dungeness. In the last photo on the right, Project Sponsor Jacob Stone with Forterra discusses conservation efforts along Indian Creek. These photos were all taken during site visits in March of 2026.
* No new or updated projects were added to the 2026 Four-Year Work Plan.
Introduction
North Olympic Peninsula Lead Entity for Salmon
Clallam County Courthouse
223 E. Fourth Street, # 5 Port Angeles, WA 98362 360/417-2326
This is the 2026 Four-Year Work Plan for the North Olympic Lead Entity for Salmon. The Lead Entity is a watershed consortium working to advance salmon restoration and protection from Blyn to Clallam County’s east side, across the Strait of Juan de Fuca to Cape Flattery and Neah Bay. This includes the saltwater nearshore of the Strait of Juan de Fuca which borders our region, as well as all rivers and water bodies which empty into the Strait. Lead Entity Members include representatives from the Jamestown S’Klallam, Lower Elwha Klallam, and Makah Tribes, Clallam County, the cities of Port Angeles and Sequim along with citizens and non-profits.
The Work Plan is used as a roadmap of work needed over the next four or more years to restore and protect habitat and recover salmon populations on the North Olympic Peninsula. It is a way to breathe life into goals from the various recovery plans and strategies which guide our work. This Work Plan includes both capital and non-capital projects, activities and programs to implement restoration of ecosystems and recovery of both listed and non-listed salmon species in our many watersheds. Even here on the Peninsula, our salmon species are still a shadow of their former selves. For example, previous returns of endangered salmon populations in major North Olympic rivers saw returns estimated in the tens of thousands, where now only a few hundred or a few thousand endangered, wild origin salmon return to spawn.
Salmon species across the Peninsula have been impacted by 150 years of habitat destruction, including construction of dikes and levees, loss of floodplains for farming and development, river channelization, legacy logging practices, removal of riparian buffers and log jams from rivers and streams, overharvest, increasing human population impacts, etc. Some of this damage and habitat destruction continues to this day. It is important to note that these changes cannot be overturned overnight because recovery takes time and involves many factors. The average salmon life cycle lasts three to five years which includes significant time in the ocean traveling great distances and over numerous national and international borders. In addition, climate change also now regularly takes a toll on salmon and steelhead and many more such impacts are unfortunately anticipated.
This Work Plan is required by the Puget Sound Partnership, our regional salmon recovery partner. They look to us to work collaboratively with our local restoration partners – the Tribes, Cities, and County, along with local non-profits such as the North Olympic Salmon Coalition and North Olympic Land Trust, among others; to help advance this work. The Work Plan is a fluid, living document. It is updated almost every year, with a call in late summer for new project concepts and updated project narratives. Those new project concepts and significantly changed narratives are scored by the Lead Entity’s Technical Review Team, then those projects are added into the list as a result of their ranking. This is a tremendous undertaking involving lots of time, thought and effort. This update was highly unusual in that there were no new project concepts or significantly updated proposals submitted in late 2025 for the 2026 Four-Year Work Plan. I attribute that to the fact there was still significant restoration project funding as a result of federal investments that happened between 2020-2024, including the bi-partisan Infrastructure Bill, along with increased state support for riparian work.
In late 2024, the Technical Review Team scored all 52 project concepts for the 2025 Work Plan. That scoring and an analysis of those results is included here since that list has been carried over given no new projects to include in 2026.
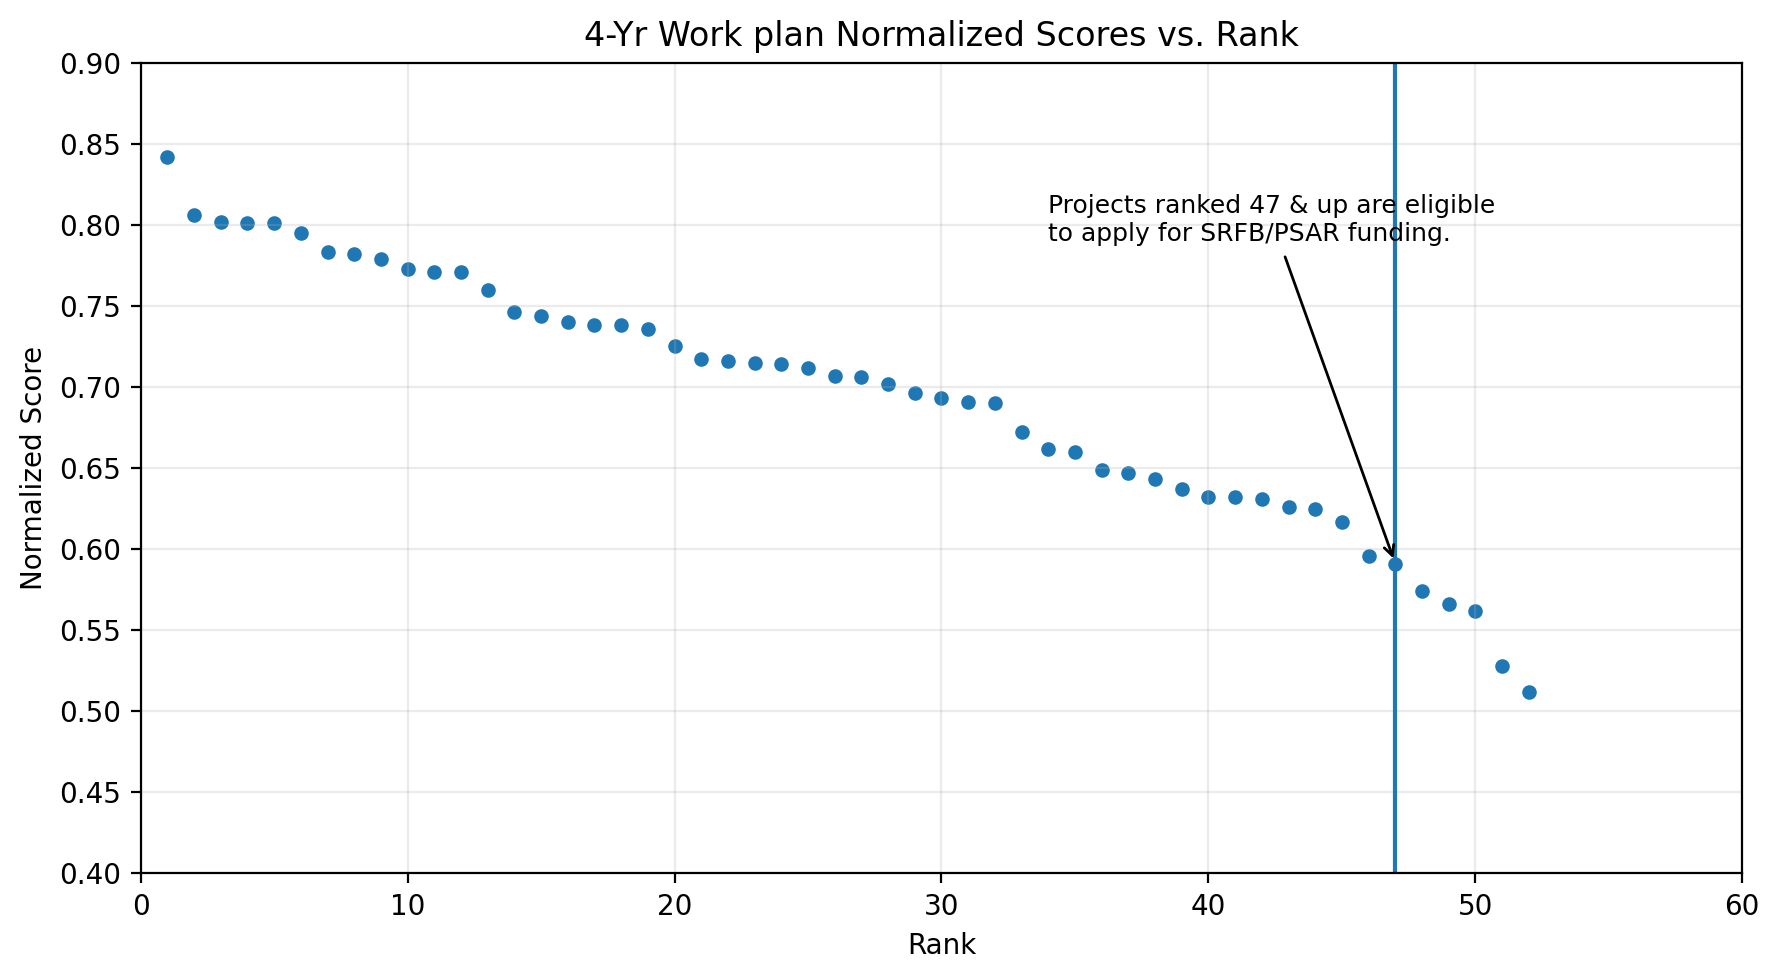
Any projects seeking grants from the Salmon Recovery Funding Board or the Puget Sound Acquisition and Restoration fund must be on the Four-Year Work Plan and must rank above the cut-off line established by the Lead Entity’s Citizens/Policy Team known as the Lead Entity Group. That cut-off line was established after a low ranking project in a non-priority watershed applied during a slow year with limited projects and received funding. This was problematic as it was considered non-strategic as it was work in a low-ranking watershed with limited salmon potential. Because of the amount of restoration work needed, and the limited funding available, we need to be able to show that we are advancing restoration projects critically-needed for salmon recovery in high priority watersheds. Sometimes the line is drawn higher on the list, forcing project sponsors to work on high priority projects. That can provide challenges because phased work is already underway in a fair number of highly-ranked Work Plan projects. Drawing the line lower on the list allows project sponsors greater leeway to advance more projects as well as accessing funding from a variety of sources. The Coordinator can also write Letters of Support and as time allows, help seek additional funding for projects above the line.
Some of the projects on the Work Plan are underway in one phase or another. Others are concepts only and have not begun. Some may never get underway. Projects can only advance with a willing landowner, a project sponsor, local support, funding, plus review and approval from funding sources. Local Restoration Practitioners and Project Sponsors could not come close to advancing all projects within our Four-Year Work Plan without significant additional funding and the increased capacity needed to develop and implement these projects.
Still, this vetted and ranked Work Plan is a well thought-out and organized way to prioritize projects needed across our expansive landscape and numerous varying watersheds. It helps guide development of projects and actions needed to implement salmon restoration and recovery and the investments needed to make that happen.
If you have questions or need more information about our work, please do not hesitate to reach out.
Ian Miller, Ph.D; Washington Sea Grant; Coastal Hazards Specialist
Jim Walton, Ph.D; Citizen, Retired Peninsula College Fisheries & Centralia College President.
Kim Williams Clallam Conservation District; Executive Director Meghan Adamire (Alt.), Clallam Conservation District; Conservation Planner
Danielle Zitomer, WA Department of Fish & Wildlife; Area Habitat Biologist Kendall Kohler (Alt.), WDFW Area Habitat Biologist
Lead Entity Staff
Cheryl Baumann, Coordinator
Lead Entity Support
Shannon Weaver, Technical Support
This report is a result of the collaborative work of the North Olympic Lead Entity for Salmon, its members, stakeholders, consultant and staff. It builds on work created by Walter Pearson, PhD of Peapod Research and Sam Gibboney of ISE Consultants.
For more information on this document or salmon recovery involving the North Olympic Peninsula Lead Entity for Salmon, please contact Coordinator Shannon Weaver at shannon.weaver@clallamcountywa.gov or by calling 360-417-2326.
WH Pearson — 1/17/2011 Peapod Research for North Olympic Peninsula Lead Entity for Salmon
Data Entered; Review & Normalization by
Cheryl Baumann, Lara Kawal & Shannon Weaver — 02/05/2024 For North Olympic Peninsula Lead Entity for Salmon
List of Ranked 2026 Work Plan Narratives
Projects Listed in Rank Order
Rank
Project ID
Title
Category
Weighted Mean Score
Normalized Score
1
09092.2
Dungeness River Floodplain Restoration
Capital
174.23
0.842
2
09030.1
Dungeness River Riparian Habitat Protection
Capital
166.77
0.806
3
22003
Dungeness Bay Shoreline Restoration
Capital
166.04
0.802
4
16103.1
Indian Creek Habitat Restoration Project
Capital
165.71
0.801
5
09029.2
Dungeness River Large Wood Restoration
Capital
165.69
0.801
6
09055.2
Elwha Estuary Conservation and Restoration
Capital
164.53
0.795
7
09091.1
Dungeness River Instream Flow Restoration-Irrigation Efficiencies
Capital
162.13
0.783
8
13102
Little River LWD Project
Capital
161.79
0.782
9
09016.3
Elwha River Engineered Log Jams
Capital
161.22
0.779
10
22005
Monitoring Dungeness Floodplain Changes
Non- Capital
126.31
0.773
11
09032.1
Dungeness Drift Cell Conservation
Capital
159.63
0.771
12
09031.3
Dungeness River Riparian Restoration
Capital
159.51
0.771
13
09009.1
Pysht River Salt Marsh Estuary Restoration Project
Capital
157.25
0.760
14
16102
Morse Creek Acquisition & Restoration
Capital
154.32
0.746
15
12098.2
Dungeness River Instream Flow Restoration-Storage
Capital
153.90
0.744
16
09093
North Sequim Bay Drift Cell Conservation Project
Capital
153.18
0.740
17
14106
Elwha Acquisition and Restoration Project
Capital
152.78
0.738
18
12096
WRIA 19 Priority Acquisitions
Capital
152.70
0.738
19
11088.3
Ennis Creek Fish Passage Barrier Removal
Capital
152.32
0.736
20
13101.1
Lower Hoko Acquisition and Restoration Project
Capital
150.08
0.725
21
11085.2
South Fork Pysht River Watershed Wood Restoration
Capital
148.30
0.717
22
19105.1
Upper Cowan Ranch ELJ Project
Capital
148.22
0.716
23
14107
Sequim Bay Shoreline Restoration
Capital
147.93
0.715
24
09013
Lower Salt Creek Restoration and Protection
Capital
147.68
0.714
25
11087
Elwha River Revegetation Project
Capital
147.42
0.712
26
19104
Lyre River Habitat Restoration Project
Capital
146.36
0.707
27
23002
Port Angeles Harbor/ Tributaries Conservation and Restoration
Capital
146.20
0.706
28
09053
Clallam Watertype Inventory and Assessment
Non- Capital
114.76
0.702
29
10079
Lower Morse Creek Feasibility Study
Capital
144.02
0.696
30
09086.1
Pysht Floodplain Acquisition and Restoration
Capital
143.40
0.693
31
09001.2
Little Hoko River Large Wood Restoration Project
Capital
143.02
0.691
32
11084
Upper Hoko LWD Restoration Project
Capital
142.77
0.690
33
22004
Ediz Hook Drift Cell Feasibility
Capital
138.97
0.672
34
19102
Hoko Culvert #80001279 Replacement
Capital
136.91
0.662
35
16104
Elwha Hot Springs Road Restoration
Capital
136.53
0.660
36
10080.3
Lyre River Protection and Restoration
Capital
134.36
0.649
37
09026
Morse Creek Property Acquisition
Capital
133.90
0.647
38
09015.1
Kreaman Creek, Trib. To Salt Creek
Capital
133.04
0.643
39
09027.2
Siebert Creek Ecosystem Protection Project
Capital
131.84
0.637
40
22001
Wright’s Creek Fish Passage Project
Capital
130.84
0.632
41
09003
WRIA 19 Riparian Restoration
Capital
130.70
0.632
42
21001
Expansion of Shipwreck Point NRCA
Capital
130.65
0.631
43
11090.1
Siebert Creek Large Wood Restoration: Old Olympic Highway to Highway 101
Capital
129.65
0.626
44
22002
Hoko Tributary Fish Passage Correction: Culvert #80001331
Capital
129.43
0.625
45
10078.1
McDonald Creek Large Wood Restoration
Capital
127.74
0.617
46
11094
Chicken Coop Road Culvert Replacement Project
Capital
123.37
0.596
47
19101
WRIA 19 Fish Passage Corrections on Joyce-Piedmont Road
Capital
122.28
0.591
Projects ranked 47 & up are eligible to apply for SRFB/PSAR funding
48
23001
Butler Creek Fish Passage Design and Construction
Capital
118.75
0.574
49
09015
Salt Creek Final Fish Passage Corrections Project
Capital
117.14
0.566
50
09021
Valley Creek Restoration Phase 3
Capital
116.22
0.562
51
09004.1
Hoko Watershed Instream LWD Restoration Project
Capital
109.21
0.528
52
09005
Sekiu Mainstem (RM 2-5) LWD Restoration
Capital
105.97
0.512
Funded Projects/ Not Ranked but included in work plan
Project ID
Title
Category
19103.1
Johnson Creek, Triple Culverts Replacement
Capital
09011
Twin River Acquisition
Capital
09039.2
McDonald Creek Barrier Removal and Channel Restoration
Capital
2026 Work Plan Update Notes
55 total projects on the work plan (52 scored & ranked & 3 incorporated by reference) 53 total projects on the work plan (Priority line drawn after project 48)
3 Funded Projects which are still incorporated within work plan but No longer Scored or in the Ranking
19703.1 Johnson Creek Triple Culverts
09039.2 McDonald Creek Barrier Removal
09011. Twins Acquisition
Scoring & Ranking Assessment
Projects ranked 47 & up are eligible to apply for SRFB/PSAR funding.
N. Olympic LE Workplan Project Proposal Scoring & Ranking Assessment
Rank
Normalized Score
1
0.842
2
0.806
3
0.802
4
0.801
5
0.801
6
0.795
7
0.783
8
0.782
9
0.779
10
0.773
11
0.771
12
0.771
13
0.760
14
0.746
15
0.744
16
0.740
17
0.738
18
0.738
19
0.736
20
0.725
21
0.717
22
0.716
23
0.715
24
0.714
25
0.712
26
0.707
27
0.706
28
0.702
29
0.696
30
0.693
31
0.691
32
0.690
33
0.672
34
0.662
35
0.660
36
0.649
37
0.647
38
0.643
39
0.637
40
0.632
41
0.632
42
0.631
43
0.626
44
0.625
45
0.617
46
0.596
47
0.591
48
0.574
49
0.566
50
0.562
51
0.528
52
0.512
Assessment of Work Plan Projects (Listed West to East)
ID
Title
Scorer(s) Outside 2 Std Deviations?
CoV% Flags for Specific Criteria?
21001
Expansion of Shipwreck Point NRCA
0
Yes (Criteria 3, 5 & 8 )
12096
WRIA 19 Priority Acquisitions
1
Yes (Criterion 5 )
19102
Hoko Culvert #80001279 Replacement
1
Yes (Criterion 5 )
19103.1
Johnson Creek, Triple Culverts Replacement
Not Scored *
Not Scored *
09001.2
Little Hoko River Large Wood Restoration Project
0
Yes (Criteria 5 & 7)
22001
Wright’s Creek Fish Passage Project
1
Yes (Criteria 5 & 7)
22002
Hoko Tributary Fish Passage Correction: Culvert #80001331
1
Yes (Criteria 5 & 7)
19105.1
Upper Cowan Ranch ELJ Project
0
Yes (Criterion 5)
09004.1
Hoko Watershed Instream LWD Restoration Project
1
Yes (Criteria 5, 7, 10 & 12)
11084
Upper Hoko LWD Restoration Project
1
Yes (Criteria 5 & 7)
13101.1
Lower Hoko Acquisition and Restoration Project
1
Yes (Criterion 5)
09005
Sekiu Mainstem (RM 2-5) LWD Restoration
1
Yes (Criteria 5, 7, 10 & 12)
09003
WRIA 19 Riparian Restoration
1
Yes (Criteria 5 & 7)
11085.2
South Fork Pysht River Watershed Wood Restoration
1
Yes (Criteria 5 & 7)
09086.1
Pysht Floodplain Acquisition and Restoration
1
Yes (Criterion 5)
09009.1
Pysht River Salt Marsh Estuary Restoration Project
1
Yes (Criterion 5)
23001
Butler Creek Fish Passage Design and Construction
0
Yes (Criteria 5 & 7)
09011
Twin River Acquisition
Not Scored *
Not Scored *
10080.3
Lyre River Protection and Restoration
0
Yes (Criteria 5, 8 & 12)
19104
Lyre River Habitat Restoration Project
0
Yes (Criteria 5 & 7)
19101
WRIA 19 Fish Passage Corrections on Joyce- Piedmont Road
1
Yes (Criteria 5 & 7)
09013
Lower Salt Creek Restoration and Protection
0
None
09015
Salt Creek Final Fish Passage Corrections Project
1
Yes (Criteria 5 & 7)
09015.1
Kreaman Creek, Trib. To Salt Creek
1
Yes (Criteria 5 & 7)
14106
Elwha Acquisition and Restoration Project
1
None
09016.3
Elwha River Engineered Log Jams
1
Yes (Criterion 7)
11087
Elwha River Revegetation Project
1
Yes (Criterion 7)
09055.2
Elwha Estuary Conservation and Restoration
0
Yes (Criterion 12)
13102
Little River LWD Project
0
Yes (Criterion 7)
16103.1
Indian Creek Habitat Restoration Project
1
None
16104
Elwha Hot Springs Road Restoration
1
Yes (Criteria 7 & 12)
22004
Ediz Hook Drift Cell Feasibility
0
Yes (Criterion 7)
23002
Port Angeles Harbor/ Tributaries Conservation and Restoration
0
Yes (Criterion 7)
09021
Valley Creek Restoration Phase 3
0
Yes (Criteria 5 & 7)
11088.3
Ennis Creek Fish Passage Barrier Removal
0
Yes (Criterion 7)
09026
Morse Creek Property Acquisition
1
None
16102
Morse Creek Acquisition & Restoration
1
None
10079
Lower Morse Creek Feasibility Study
0
Yes (Criteria 7 & 12)
09027.2
Siebert Creek Ecosystem Protection Project
1
Yes (Criteria 5, 8 & 12)
11090.1
Siebert Creek Large Wood Restoration: Old Olympic Highway to Highway 101
1
Yes (Criterion 7)
10078.1
McDonald Creek Large Wood Restoration
1
Yes (Criterion 7)
09039.2
McDonald Creek Barrier Removal and Channel Restoration
Not Scored *
Not Scored *
22003
Dungeness Bay Shoreline Restoration
1
None
22005
Monitoring Dungeness Floodplain Changes
0
Yes (Criterion 6)
09029.2
Dungeness River Large Wood Restoration
1
Yes (Criterion 7)
09030.1
Dungeness River Riparian Habitat Protection
1
None
09031.3
Dungeness River Riparian Restoration
0
Yes (Criterion 7)
09032.1
Dungeness Drift Cell Conservation
1
Yes (Criterion 8)
09091.1
Dungeness River Instream Flow Restoration- Irrigation Efficiencies
0
Yes (Criterion 7)
12098.2
Dungeness River Instream Flow Restoration- Storage
0
Yes (Criterion 7)
09092.2
Dungeness River Floodplain Restoration
1
None
14107
Sequim Bay Shoreline Restoration
0
None
09093
North Sequim Bay Drift Cell Conservation Project
0
Yes (Criterion 8)
11094
Chicken Coop Road Culvert Replacement Project
0
Yes (Criterion 7)
09053
Clallam Watertype Inventory and Assessment
0
Yes (Criteria 1, 6 & 8)
Not Scored* Indicates project is currently funded and has been scored in previously work plans. They are still incorporated by reference as part of this Work Plan.
2026 Narrative Ranking Workbook
NS = No Score Given. CoV = Coefficient of Variation (Standard deviation/Mean as %).
Expansion of Shipwreck Point NRCA scoring worksheet
ID
Criteria for Ranking
Scorer 1
Scorer 2
Scorer 3
Scorer 4
Scorer 5
Scorer 6
Scorer 7
Scorer 8
Scorer 9
Scorer 10
Scorer 11
Scorer 12
Scorer 13
Scorer 14
Mean Score
Weight
Weighted Mean Score
CoV (%)
1
Watershed Priority
4.639
4.639
4.639
4.639
4.639
4.639
4.639
4.639
4.639
4.639
4.639
4.639
4.639
4.639
4.639
2.96
13.74
0.0%
2
Addresses limiting factor(s)
2.5
NS
3.0
1.0
2.5
2.0
NS
4.0
4.5
3.5
4.0
1.0
4.0
4.0
3.000
4.08
12.23
40.2%
3
Addresses stock status and trends
2.0
NS
5.0
1.0
2.0
1.0
NS
2.0
4.5
0.5
4.0
1.0
4.0
4.0
2.583
2.88
7.45
62.2%
4
Addresses progress toward recovery
2.5
NS
3.0
2.0
2.0
1.5
NS
2.0
5.0
3.0
4.0
0.0
4.0
4.0
2.750
2.81
7.72
49.9%
5
Addresses an ESA-listed stock
0.5
NS
5.0
1.0
1.0
1.5
NS
2.0
4.0
1.0
4.0
1.0
3.0
4.5
2.375
3.65
8.68
68.4%
6
Addresses other stocks
2.5
NS
3.5
5.0
2.0
2.0
NS
3.0
4.0
1.0
4.0
1.0
4.0
4.5
3.042
3.27
9.94
44.0%
7
Protects high-quality fish habitat
2.5
NS
4.0
5.0
2.0
3.0
NS
3.0
4.5
5.0
4.0
3.0
4.0
4.5
3.708
4.12
15.26
26.6%
8
Restores formerly productive habitat
2.5
NS
2.0
3.0
2.0
3.0
NS
2.0
4.0
1.0
3.0
0.0
4.5
1.0
2.333
4.04
9.42
55.1%
9
Supports restoration and maintenance of ecosystem functions
2.0
NS
2.5
5.0
2.5
3.0
NS
3.0
4.0
4.0
4.0
2.0
4.5
4.0
3.375
3.88
13.11
29.7%
10
Spatial Scale of Influence
2.5
NS
3.5
4.5
2.5
3.0
NS
2.0
2.5
4.0
4.0
2.0
4.0
3.0
3.125
3.62
11.30
27.4%
11
Temporal Scale of Influence
3.0
NS
5.0
5.0
3.0
3.0
NS
5.0
5.0
5.0
4.0
3.0
5.0
5.0
4.250
3.23
13.73
22.7%
12
Project Readiness
2.5
NS
3.0
5.0
1.5
3.0
NS
5.0
2.5
3.0
2.0
2.0
4.0
0.5
2.833
2.85
8.06
47.2%
Mean
2.47
4.64
3.68
3.51
2.30
2.55
4.64
3.14
4.09
2.97
3.80
1.72
4.14
3.64
Overall Weighted Score
130.65
CoV
37.3%
28.3%
50.6%
39.0%
38.8%
39.0%
20.2%
56.7%
17.6%
78.4%
11.9%
39.6%
Outside 2 Standard Deviations?
N
N
N
N
N
N
N
N
N
N
N
N
N
N
Comments
Fairly straight forward nearshore protection project – high community priority, which makes sense, but perhaps not for fish recovery (i.e. scoring can't reflect that community priority)
Lyre River Habitat Restoration Project scoring worksheet
ID
Criteria for Ranking
Scorer 1
Scorer 2
Scorer 3
Scorer 4
Scorer 5
Scorer 6
Scorer 7
Scorer 8
Scorer 9
Scorer 10
Scorer 11
Scorer 12
Scorer 13
Scorer 14
Mean Score
Weight
Weighted Mean Score
CoV (%)
1
Watershed Priority
3.193
3.193
3.193
3.193
3.193
3.193
3.193
3.193
3.193
3.193
3.193
3.193
3.193
3.193
3.193
2.96
9.46
0.0%
2
Addresses limiting factor(s)
3.0
4.0
4.0
3.0
NS
2.5
4.0
4.5
5.0
5.0
5.0
3.0
4.0
4.0
3.923
4.08
15.99
21.4%
3
Addresses stock status and trends
3.0
3.5
4.0
4.0
NS
2.5
3.5
4.0
4.5
4.0
5.0
3.0
3.5
4.0
3.731
2.88
10.76
17.8%
4
Addresses progress toward recovery
3.0
3.0
4.5
5.0
NS
3.0
3.5
4.5
4.5
3.5
5.0
3.0
5.0
4.0
3.962
2.81
11.12
20.9%
5
Addresses an ESA-listed stock
0.0
3.5
0.0
1.0
NS
3.0
2.0
0.0
3.0
0.0
5.0
0.0
4.0
0.0
1.654
3.65
6.04
111.3%
6
Addresses other stocks
3.0
3.5
4.5
5.0
NS
3.0
3.5
4.5
5.0
5.0
4.5
3.5
4.0
4.0
4.077
3.27
13.33
17.9%
7
Protects high-quality fish habitat
2.5
2.5
1.0
2.0
NS
4.0
0.0
4.5
4.0
5.0
5.0
4.0
5.0
0.0
3.038
4.12
12.50
60.6%
8
Restores formerly productive habitat
2.5
4.0
4.5
4.0
NS
2.5
4.0
4.5
4.5
5.0
4.5
3.5
3.5
4.0
3.923
4.04
15.84
19.4%
9
Supports restoration and maintenance of ecosystem functions
3.0
3.5
4.5
5.0
NS
3.5
4.0
4.5
4.5
5.0
4.5
4.0
5.0
4.0
4.231
3.88
16.43
15.0%
10
Spatial Scale of Influence
3.0
4.0
4.0
4.0
NS
3.5
4.0
3.5
3.0
3.0
4.5
3.0
4.0
4.0
3.654
3.62
13.21
14.1%
11
Temporal Scale of Influence
2.5
4.0
5.0
5.0
NS
3.0
3.5
4.0
5.0
5.0
5.0
3.0
5.0
5.0
4.231
3.23
13.67
22.4%
12
Project Readiness
2.0
4.0
2.5
5.0
NS
3.0
2.5
4.0
2.0
3.0
0.0
3.0
3.0
2.5
2.808
2.85
7.99
42.7%
Mean
2.56
3.56
3.47
3.85
3.19
3.06
3.14
3.81
4.02
3.89
4.27
3.02
4.10
3.22
Overall Weighted Score
146.36
CoV
34.2%
13.5%
44.7%
34.5%
14.8%
37.2%
33.6%
24.5%
38.6%
33.7%
34.0%
18.1%
50.1%
Outside 2 Standard Deviations?
N
N
N
N
N
N
N
N
N
N
N
N
N
N
Comments
The workplan write up is fine but the project description is not. Including information about a prior acquisition muddies the intent here which is restoration, not acquisition. This could prove problematic and should be clarified.
Port Angeles Harbor/ Tributaries Conservation and Restoration
Project ID
23002
Overall Weighted Score
146.20
Mean of all Scores
3.71
SD of all Scores
0.68
2 X SD of all Scores
1.36
Mean – 2 X
2.35
Mean + 2 X
5.07
Port Angeles Harbor/ Tributaries Conservation and Restoration scoring worksheet
ID
Criteria for Ranking
Scorer 1
Scorer 2
Scorer 3
Scorer 4
Scorer 5
Scorer 6
Scorer 7
Scorer 8
Scorer 9
Scorer 10
Scorer 11
Scorer 12
Scorer 13
Scorer 14
Mean Score
Weight
Weighted Mean Score
CoV (%)
1
Watershed Priority
4.639
4.639
4.639
4.639
4.639
4.639
4.639
4.639
4.639
4.639
4.639
4.639
4.639
4.639
4.639
2.96
13.74
0.0%
2
Addresses limiting factor(s)
2.5
3.5
3.5
3.0
NS
3.0
4.0
4.0
4.0
NS
5.0
3.5
3.0
4.0
3.583
4.08
14.61
18.7%
3
Addresses stock status and trends
2.5
3.0
5.0
3.0
NS
3.0
2.5
3.0
4.0
NS
5.0
4.0
4.0
5.0
3.667
2.88
10.58
26.2%
4
Addresses progress toward recovery
3.0
3.0
3.0
5.0
NS
3.5
3.0
3.0
4.5
NS
5.0
4.0
4.0
5.0
3.833
2.81
10.76
22.5%
5
Addresses an ESA-listed stock
2.0
3.0
5.0
5.0
NS
3.0
3.0
4.0
3.5
NS
5.0
4.0
4.0
5.0
3.875
3.65
14.16
25.9%
6
Addresses other stocks
2.0
3.0
4.0
5.0
NS
3.5
3.0
4.0
3.5
NS
5.0
4.0
4.0
5.0
3.833
3.27
12.53
23.8%
7
Protects high-quality fish habitat
2.0
2.5
2.0
4.0
NS
3.5
0.0
3.0
3.5
NS
5.0
4.5
1.0
0.0
2.583
4.12
10.63
63.8%
8
Restores formerly productive habitat
2.5
3.5
3.5
3.0
NS
3.5
3.0
3.5
3.5
NS
5.0
3.5
1.0
2.0
3.125
4.04
12.62
31.4%
9
Supports restoration and maintenance of ecosystem functions
3.5
3.0
4.0
5.0
NS
3.5
3.0
3.5
3.5
NS
5.0
4.0
2.0
4.0
3.667
3.88
14.24
22.8%
10
Spatial Scale of Influence
2.5
3.0
2.5
5.0
NS
4.0
3.5
4.0
3.0
NS
5.0
4.0
4.0
4.0
3.708
3.62
13.41
22.6%
11
Temporal Scale of Influence
3.0
3.0
4.5
4.0
NS
3.5
3.5
3.5
4.5
NS
5.0
4.0
3.0
5.0
3.875
3.23
12.52
19.2%
12
Project Readiness
1.5
3.0
2.0
1.0
NS
3.0
1.0
3.0
2.0
NS
3.5
4.0
1.0
2.0
2.250
2.85
6.40
45.9%
Mean
2.64
3.18
3.64
3.97
4.64
3.47
2.84
3.59
3.68
4.64
4.84
4.01
2.97
3.80
Overall Weighted Score
146.20
CoV
31.5%
16.6%
29.7%
31.7%
13.8%
43.9%
15.0%
19.9%
9.0%
8.1%
46.2%
42.7%
Outside 2 Standard Deviations?
N
N
N
N
N
N
N
N
N
N
N
N
N
N
Comments
Overarching and nebulous. Needs assessment of specific actions and locations phased approach. Polluted environment. Given the cost/benefit – other undeveloped spot should be priority.
Dungeness River Instream Flow Restoration-Irrigation Efficiencies
Project ID
09091.1
Overall Weighted Score
162.13
Mean of all Scores
4.00
SD of all Scores
0.79
2 X SD of all Scores
1.57
Mean – 2 X
2.42
Mean + 2 X
5.57
Dungeness River Instream Flow Restoration-Irrigation Efficiencies scoring worksheet
ID
Criteria for Ranking
Scorer 1
Scorer 2
Scorer 3
Scorer 4
Scorer 5
Scorer 6
Scorer 7
Scorer 8
Scorer 9
Scorer 10
Scorer 11
Scorer 12
Scorer 13
Scorer 14
Mean Score
Weight
Weighted Mean Score
CoV (%)
1
Watershed Priority
4.699
4.699
4.699
4.699
4.699
4.699
4.699
4.699
4.699
4.699
4.699
4.699
4.699
4.699
4.699
2.96
13.92
0.0%
2
Addresses limiting factor(s)
3.0
4.0
3.5
5.0
3.5
4.0
3.0
3.5
5.0
5.0
4.0
NS
5.0
5.0
4.115
4.08
16.78
19.3%
3
Addresses stock status and trends
2.5
4.0
5.0
4.0
3.0
3.0
2.5
3.0
5.0
5.0
5.0
NS
5.0
5.0
4.000
2.88
11.54
26.5%
4
Addresses progress toward recovery
3.0
4.0
3.5
4.0
3.0
4.0
2.5
4.5
5.0
4.0
5.0
NS
4.5
4.0
3.923
2.81
11.01
19.4%
5
Addresses an ESA-listed stock
3.0
4.0
5.0
5.0
2.5
3.5
3.5
4.0
5.0
5.0
5.0
NS
5.0
5.0
4.269
3.65
15.60
21.2%
6
Addresses other stocks
3.0
4.0
4.5
5.0
3.5
3.5
3.0
3.0
5.0
5.0
5.0
NS
5.0
5.0
4.192
3.27
13.71
21.0%
7
Protects high-quality fish habitat
2.5
3.0
0.0
4.0
0.0
3.0
0.0
4.0
5.0
5.0
4.0
NS
5.0
4.0
3.038
4.12
12.50
62.5%
8
Restores formerly productive habitat
2.5
4.0
3.0
2.0
2.5
2.0
2.0
3.0
5.0
5.0
4.0
NS
5.0
4.0
3.385
4.04
13.67
34.7%
9
Supports restoration and maintenance of ecosystem functions
3.0
4.0
3.0
5.0
3.5
3.5
2.0
4.0
5.0
5.0
4.5
NS
5.0
4.5
4.000
3.88
15.54
23.9%
10
Spatial Scale of Influence
3.0
4.0
3.0
4.0
3.0
3.5
2.5
3.0
5.0
5.0
5.0
NS
5.0
4.5
3.885
3.62
14.04
24.2%
11
Temporal Scale of Influence
3.5
3.5
4.0
5.0
3.5
3.5
3.0
3.0
5.0
5.0
5.0
NS
5.0
5.0
4.154
3.23
13.42
20.5%
12
Project Readiness
2.5
4.0
4.0
5.0
4.5
3.0
1.5
4.0
4.5
3.0
3.5
NS
5.0
3.0
3.654
2.85
10.40
28.1%
Mean
3.02
3.93
3.60
4.39
3.10
3.43
2.52
3.64
4.93
4.72
4.56
4.70
4.93
4.47
Overall Weighted Score
162.13
CoV
20.3%
10.0%
37.8%
20.2%
38.3%
19.4%
45.4%
17.5%
3.3%
13.1%
11.9%
3.3%
13.9%
Outside 2 Standard Deviations?
N
N
N
N
N
N
N
N
N
N
N
N
N
N
Comments
What are impacts? Loss of amphibians/aquatic veg. + animals in ditches use by waterfowl loss of groundwater recharge. How does this really translate? When water flows are very low in late summer irrigators face restrictions that won't change.
Low flow thresholds are likely to occur most summers – will piping really save about 7cfs? when draws will be restricted anyway? Of course the water "savings" will be through the whole irrigation season. Will the "saved" water stay in the river or used for other commercial/residential uses?
Dungeness River Instream Flow Restoration-Storage scoring worksheet
ID
Criteria for Ranking
Scorer 1
Scorer 2
Scorer 3
Scorer 4
Scorer 5
Scorer 6
Scorer 7
Scorer 8
Scorer 9
Scorer 10
Scorer 11
Scorer 12
Scorer 13
Scorer 14
Mean Score
Weight
Weighted Mean Score
CoV (%)
1
Watershed Priority
4.699
4.699
4.699
4.699
4.699
4.699
4.699
4.699
4.699
4.699
4.699
4.699
4.699
4.699
4.699
2.96
13.92
0.0%
2
Addresses limiting factor(s)
2.5
4.0
3.5
5.0
2.5
3.0
3.5
4.0
5.0
5.0
NS
NS
5.0
4.5
3.958
4.08
16.14
24.4%
3
Addresses stock status and trends
3.0
4.0
5.0
4.0
2.0
3.0
2.5
4.0
5.0
5.0
NS
NS
5.0
4.5
3.917
2.88
11.30
27.1%
4
Addresses progress toward recovery
3.0
4.0
3.5
3.0
2.0
3.5
2.5
3.5
5.0
4.0
NS
NS
5.0
4.5
3.625
2.81
10.18
25.7%
5
Addresses an ESA-listed stock
2.5
4.0
5.0
5.0
2.5
3.0
3.0
4.0
5.0
5.0
NS
NS
5.0
5.0
4.083
3.65
14.92
26.0%
6
Addresses other stocks
2.5
4.0
4.5
5.0
2.0
3.0
3.0
3.0
5.0
5.0
NS
NS
5.0
5.0
3.917
3.27
12.80
29.2%
7
Protects high-quality fish habitat
2.5
3.0
0.0
5.0
0.0
3.0
0.0
4.0
5.0
5.0
NS
NS
5.0
4.0
3.042
4.12
12.52
66.7%
8
Restores formerly productive habitat
2.5
4.0
3.0
2.0
1.5
2.0
2.0
3.0
5.0
5.0
NS
NS
5.0
4.0
3.250
4.04
13.13
40.2%
9
Supports restoration and maintenance of ecosystem functions
3.0
4.0
3.0
5.0
1.0
3.5
2.0
4.0
5.0
5.0
NS
NS
5.0
4.0
3.708
3.88
14.41
34.7%
10
Spatial Scale of Influence
3.0
4.0
3.0
4.0
3.0
3.5
2.5
3.0
5.0
3.5
NS
NS
5.0
4.5
3.667
3.62
13.26
22.8%
11
Temporal Scale of Influence
3.5
3.5
4.0
4.0
3.0
3.5
3.5
3.0
5.0
5.0
NS
NS
5.0
5.0
4.000
3.23
12.92
19.9%
12
Project Readiness
3.0
4.0
2.0
5.0
3.0
1.0
2.0
3.0
4.0
3.0
NS
NS
2.5
3.0
2.958
2.85
8.42
35.6%
Mean
2.97
3.93
3.43
4.31
2.27
3.06
2.60
3.60
4.89
4.60
4.70
4.70
4.77
4.39
Overall Weighted Score
153.90
CoV
21.2%
10.0%
41.5%
22.5%
51.8%
29.3%
43.7%
16.4%
6.0%
15.3%
15.1%
13.1%
Outside 2 Standard Deviations?
N
N
N
N
N
N
N
N
N
N
N
N
N
N
Comments
If reservoir size is reduced, is project still worth the investment? Explain prohibitions (if any) from using conserved water for other uses, ie.. commerical + residential. Describe impacts, such as reduction/loss and proposed mitigation of Corylus cornuta, Ribes lobbii, Heuchera chlorautha at proposed res. site. If water conservation was really important then new residential development would be capped.
The project description was poorly written. If the proponent cannot communicate clearly in writing a proposal they are unlikely to adequately do so when reporting the results of the proposed study. The scientist(s) conducting the monitoring were not identified and no credentials or experience cited.
N. Olympic LE Workplan Capital WORK PLAN Project Criteria
ID
Criteria for Ranking
Criteria Narrative
0
1
2
3
4
5
Mean Weight
1
Watershed Priority
What is the watershed priority score for this proposal? This criterion is mandated by regulation. The score is calculated based on data concerning historical and current productivity and stock diversity of the NOPLE watersheds. This score is added by Lead Entity staff for the watershed(s) covered by the proposed project.
Watershed priority scores have been calculated for each NOPLE watershed. The calculation produced a numerical score based on difference between historical and current watershed productivity plus historical number of stock and stock elements. See separate Watershed Priority Table for data and more details on the calculation.
2.96
2
Addresses limiting factor(s)
How well does the proposed work address the limiting factor(s) pertinent to the watershed and stock?
Does not mention or address a limiting factor at all
Mentions a limiting factor, but addresses only vaguely
Indirectly addresses a limiting factor but only minimally
Indirectly addresses a limiting factor, but only moderately, OR Directly addresses limiting factor, but only minimally
Addresses a limiting factor directly and moderately
Addresses a limiting factor directly and substantially
4.08
3
Addresses stock status and trends
How well does the proposed work address the status and trends of the stock(s) of interest?
Stock fully recovered; no more work needed
Addresses recovered stock
Addresses rebuilding stock
Addresses depressed stock that is increasing
Addresses depressed stock that is decreasing
Addresses critical stock
2.88
4
Addresses progress toward recovery
To what extent does the watershed or nearshore area need further habitat protection and/or restoration efforts?
Recovery completed; needs no further efforts to complete recovery
Recovery in progress; needs just a little protection and/or restoration effort to complete recovery
Recovery in progress; needs some protection and/or restoration effort to complete recovery
Recovery in progress; needs moderate protection and/or restoration effort to complete recovery
Recovery in progress; needs more than moderate protection and/or restoration effort to complete recovery
Recovery in progress; needs substantial or major protection and/or restoration effort to complete recovery
2.81
5
Addresses an ESA- listed stock
To what extent does the project benefit listed stocks?
Does not mention or address a listed stock at all
Mentions listed stock, but addresses only vaguely
Indirectly addresses listed stock and only minimally
Indirectly addresses listed stock moderately OR Directly addresses listed stock only minimally
Directly and moderately addresses listed stock
Directly and substantially addresses listed stock
3.65
6
Addresses other stocks
To what extent does the project benefit non-listed stocks?
Does not mention or address a non-listed stock at all
Mentions non-listed stock, but addresses only vaguely
Indirectly addresses non-listed stock and only minimally
Indirectly addresses non-listed stock moderately OR Directly addresses non-listed stock only minimally
Directly and moderately addresses non-listed stock
Directly and substantially addresses non-listed stock
3.27
7
Protects high- quality fish habitat
How well does the proposed work and instrument protect fish habitat?
Does not mention or address criterion at all; benefits not discernible
Mentions habitat protections but addresses criterion only vaguely; benefits uncertain at best
Addresses criterion only indirectly with only minimal benefits
Addresses criterion indirectly with moderate benefits OR addresses criterion directly with only minimal benefits
Addresses criterion directly with moderate benefits
Addresses criterion directly with substantial benefits
4.12
8
Restores formerly productive habitat
How well does the project restore formerly productive habitat?
Does not mention or address criterion at all; benefits not discernible
Mentions habitat restoration but addresses criterion only vaguely; benefits uncertain at best
Addresses criterion only indirectly with only minimal benefits
Addresses criterion indirectly with moderate benefits OR addresses criterion directly with only minimal benefits
Addresses criterion directly with moderate benefits
Addresses criterion directly with substantial benefits
4.04
9
Supports restoration and maintenance of ecosystem functions
How well does the project restore and maintain ecosystem functions?
Does not mention or address criterion at all; benefits not discernible
Mentions ecosystem restoration but addresses criterion only vaguely; benefits uncertain at best
Addresses criterion only indirectly with only minimal benefits
Addresses criterion indirectly with moderate benefits OR addresses criterion directly with only minimal benefits
Addresses criterion directly with moderate benefits
Addresses criterion directly with substantial benefits
3.88
10
Spatial Scale of Influence
How far does the spatial scale of influence extend through a watershed or nearshore area?
Potential spatial scale of influence not mentioned or addressed; scale of benefits not discernible
Potential scale of influence minimal; Benefits local (limited to project area) at most and uncertain
Potential scale of influence slight; scale of benefits more than local and discernible
Potential scale of influence over a moderate portion of a watershed or nearshore area; benefits moderate and spread beyond the project area through part of the system
Potential scale of influence over a majority of a watershed or nearshore area; benefits more than moderate and spread through much of the system
Potential scale of influence over a watershed or nearshore area; benefits substantial and spread through essentially all of the system
3.62
11
Temporal Scale of Influence
How far does the temporal scale of influence extend through a watershed or nearshore area?
Potential temporal scale of influence not mentioned or addressed; scale of benefits not discernible
Potential scale of influence minimal; Benefits seasonal at most and uncertain
Potential scale of influence slight; scale of benefits more than seasonal but less than 1 year and discernible
Potential scale of influence of moderate duration; benefits moderate and endure for 2 to 4 years
Potential scale of influence of more than moderate duration; benefits moderate and endure for 5 to 10 years
Potential scale of influence of long- term to indefinite duration; benefits substantial and endure beyond 10 years
3.23
12
Project Readiness
How ready is the project to start now, if funded?
Not ready for foreseeable future; Time to overcome known obstacles and fulfill requirements is not determined but not in immediate future
Not ready for some years; time to overcome known obstacles and fulfill requirements is greater than 5 years
Ready within 3 or 4 years; Remaining obstacles and requirements can be resolved over 3 to 4 years
Ready within 2 years; remaining obstacles and requirements can be resolved within 2 years
Ready next year; remaining obstacles and requirements can be resolved within 1 year
Ready to start now given award of funds; no remaining obstacles or requirements; a ready-to-go project
2.85
Capital Project Maximum Possible Score
Overall Weighted Score: 206.96
Capital Project — MAXIMUM POSSIBLE SCORE
ID
Criteria for Ranking
Scorer 1
Scorer 2
Scorer 3
Scorer 4
Scorer 5
Scorer 6
Scorer 7
Scorer 8
Scorer 9
Scorer 10
Scorer 11
Scorer 12
Scorer 13
Scorer 14
Mean Score
Weight
Weighted Mean Score
CoV (%)
1
Watershed Priority
5.000
5.000
5.000
5.000
5.000
5.000
5.000
5.000
5.000
5.000
5.000
5.000
5.000
5.000
5.000
2.96
14.81
0.0%
2
Addresses limiting factor(s)
5.00
5.00
5.00
5.00
5.00
5.00
5.00
5.00
5.00
5.00
5.00
5.00
5.00
5.00
5.00
4.08
20.40
0.0%
3
Addresses stock status and trends
5.00
5.00
5.00
5.00
5.00
5.00
5.00
5.00
5.00
5.00
5.00
5.00
5.00
5.00
5.00
2.88
14.40
0.0%
4
Addresses progress toward recovery
5.00
5.00
5.00
5.00
5.00
5.00
5.00
5.00
5.00
5.00
5.00
5.00
5.00
5.00
5.00
2.81
14.05
0.0%
5
Addresses an ESA-listed stock
5.00
5.00
5.00
5.00
5.00
5.00
5.00
5.00
5.00
5.00
5.00
5.00
5.00
5.00
5.00
3.65
18.25
0.0%
6
Addresses other stocks
5.00
5.00
5.00
5.00
5.00
5.00
5.00
5.00
5.00
5.00
5.00
5.00
5.00
5.00
5.00
3.27
16.35
0.0%
7
Protects high-quality fish habitat
5.00
5.00
5.00
5.00
5.00
5.00
5.00
5.00
5.00
5.00
5.00
5.00
5.00
5.00
5.00
4.12
20.60
0.0%
8
Restores formerly productive habitat
5.00
5.00
5.00
5.00
5.00
5.00
5.00
5.00
5.00
5.00
5.00
5.00
5.00
5.00
5.00
4.04
20.20
0.0%
9
Supports restoration and maintenance of ecosystem functions
5.00
5.00
5.00
5.00
5.00
5.00
5.00
5.00
5.00
5.00
5.00
5.00
5.00
5.00
5.00
3.88
19.40
0.0%
10
Spatial Scale of Influence
5.00
5.00
5.00
5.00
5.00
5.00
5.00
5.00
5.00
5.00
5.00
5.00
5.00
5.00
5.00
3.62
18.10
0.0%
11
Temporal Scale of Influence
5.00
5.00
5.00
5.00
5.00
5.00
5.00
5.00
5.00
5.00
5.00
5.00
5.00
5.00
5.00
3.23
16.15
0.0%
12
Project Readiness
5.00
5.00
5.00
5.00
5.00
5.00
5.00
5.00
5.00
5.00
5.00
5.00
5.00
5.00
5.00
2.85
14.25
0.0%
Mean
5.00
5.00
5.00
5.00
5.00
5.00
5.00
5.00
5.00
5.00
5.00
5.00
5.00
5.00
Overall Weighted Score
206.96
CoV
0.0%
0.0%
0.0%
0.0%
0.0%
0.0%
0.0%
0.0%
0.0%
0.0%
0.0%
0.0%
0.0%
0.0%
Outside 2 Standard Deviations?
N
N
N
N
N
N
N
N
N
N
N
N
N
N
Non-Capital Scoring Criteria
Final wording and weights from Fall 2013 Retreat. New or modified wording in BOLDFACE Italics
The scale for criterion mean weight is from 1 to 5, with 5 being highest.
Criteria 1 through 9 inclusive are used to assess Work Plan Narratives for NON-Capital Projects.
All Criteria are used to assess Project Proposals for Current Year’s funding.
North Olympic Peninsula Lead Entity (NOPLE) for Salmon — Criteria & Weights for Scoring and Ranking NON-Capital Projects
ID
Criteria for Ranking
Criteria Narratives
Mean Weight
1
Advances robust harvestable stocks
This criterion derives from NOPLE's GOAL to achieve harvestable fish stocks. To what extent does the proposed work lead to progress towards harvestable fish stocks?
3.23
2
Advances implementation of recovery plan(s)
This criterion derives from NOPLE's GOAL to implement recovery plans. To what extent does the proposed work lead to progress in the implementation of recovery plan(s)?
3.73
3
Advances habitat protection and restoration
This criterion derives from NOPLE's GOAL to protect and restore salmon habitat. To what extent does the proposed work lead to progress in protecting and/or restoring salmon habitat?
4.05
4
Advances recovery of ecosystem function
This criterion derives from NOPLE's GOAL to support recovery and restoration of ecosystem function. To what extent does the proposed work lead to progress in the recovery and restoration of ecosystem function(s)?
4.21
5
Advances ecosystem awareness
This criterion derives from NOPLE's GOAL to instill ecosystem awareness. To what extent does the proposed work increase the ecosystem awareness and its application? To what extent does the proposed work address and overcome obstacles to awareness?
2.81
6
Advances integration
This criterion derives from NOPLE's objective of advancing the integrations of the four H's: Habitat, Harvest, Hatcheries, and Hydropower. To what extent does the proposed work acknowledge the influence of the other H's on the work and the potential influence of the work on the other H's?
2.05
7
Fulfills requirements of external agencies
This criterion derives from NOPLE's objective to network with other entities and agencies. To what extent does the proposed work recognize and coordinate with the efforts and requirements of agencies? To what extent does the proposed work contribute to the knowledge and databases at the regional and state levels?
1.71
8
Advances multi- agency funding strategy
This criterion derives from NOPLE's objective of diversifying the funding base. To what extent will the proposed work be eligible and competitive for Non-SRFB funding?
1.81
9
Has large spatial- temporal scale of effects
This criterion derives from NOPLE's objective to support non-capital projects that benefit salmon recovery on a NOPLE-wide or regional basis. To what extent does the proposed work aid salmon recovery to a broad degree in time and space?
3.38
10
Likelihood of success based on proposer's past success in implementation
This criterion is a standard one in project selection and management. What is the probability that the project sponsor will succeed with the proposed work given their previous experience and current expertise and capability with the type of work proposed?
1.92
11
Likelihood of success based on approach
This criterion is a standard one in project selection and management. Is the approach appropriate to the work proposed? What is the probability of success of the proposed approach?
3.10
12
Reasonableness of cost and budget
This criterion is a standard one in project selection and management. Do the scope of work, overall estimated cost, and budget align? Are the budget items and costs reasonable given the scope of work?
2.69
Non Capital Project Maximum Possible Score
Overall Weighted Score: 163.47
Non Capital Project — MAXIMUM POSSIBLE SCORE
ID
Criteria for Ranking
Scorer 1
Scorer 2
Scorer 3
Scorer 4
Scorer 5
Scorer 6
Scorer 7
Scorer 8
Scorer 9
Scorer 10
Scorer 11
Scorer 12
Scorer 13
Scorer 14
Mean Score
Weight
Weighted Mean Score
CoV (%)
1
Advances robust harvestable stocks
5.0
5.0
5.0
5.0
5.0
5.0
5.0
5.0
5.0
5.0
5.0
5.0
5.0
5.0
5.0
3.5
17.36
0.0%
2
Advances implementation of recovery plans
5.0
5.0
5.0
5.0
5.0
5.0
5.0
5.0
5.0
5.0
5.0
5.0
5.0
5.0
5.0
4.0
20.14
0.0%
3
Advances habitat protection and restoration
5.0
5.0
5.0
5.0
5.0
5.0
5.0
5.0
5.0
5.0
5.0
5.0
5.0
5.0
5.0
4.4
22.08
0.0%
4
Advances recovery of ecosystem function
5.0
5.0
5.0
5.0
5.0
5.0
5.0
5.0
5.0
5.0
5.0
5.0
5.0
5.0
5.0
4.3
21.53
0.0%
5
Advances ecosystem awareness
5.0
5.0
5.0
5.0
5.0
5.0
5.0
5.0
5.0
5.0
5.0
5.0
5.0
5.0
5.0
2.8
13.89
0.0%
6
Advances integration
5.0
5.0
5.0
5.0
5.0
5.0
5.0
5.0
5.0
5.0
5.0
5.0
5.0
5.0
5.0
2.3
11.39
0.0%
7
Fulfills requirements of external agencies
5.0
5.0
5.0
5.0
5.0
5.0
5.0
5.0
5.0
5.0
5.0
5.0
5.0
5.0
5.0
2.3
11.53
0.0%
8
Advances multi-agency funding strategy
5.0
5.0
5.0
5.0
5.0
5.0
5.0
5.0
5.0
5.0
5.0
5.0
5.0
5.0
5.0
2.0
10.14
0.0%
9
Spatial scale of influence
5.0
5.0
5.0
5.0
5.0
5.0
5.0
5.0
5.0
5.0
5.0
5.0
5.0
5.0
5.0
3.6
17.78
0.0%
10
Temporal scale of influence
5.0
5.0
5.0
5.0
5.0
5.0
5.0
5.0
5.0
5.0
5.0
5.0
5.0
5.0
5.0
3.5
17.64
0.0%
Mean
5.0
5.0
5.0
5.0
5.0
5.0
5.0
5.0
5.0
5.0
5.0
5.0
5.0
5.0
Overall Weighted Score
163.47
CoV
0.0%
0.0%
0.0%
0.0%
0.0%
0.0%
0.0%
0.0%
0.0%
0.0%
0.0%
0.0%
0.0%
0.0%
Outside 2 Standard Deviations?
N
N
N
N
N
N
N
N
N
N
N
N
N
N
Final Watershed Priorities Sorted by Standardized Score
Final Watershed Priorities Sorted by Standardized Score
Comments
Fairly straight forward nearshore protection project – high community priority, which makes sense, but perhaps not for fish recovery (i.e. scoring can't reflect that community priority)